Preseason Bracketology: Our First 2021 NCAA Tournament Bracket Prediction
November 24, 2020 – by Jason Lisk
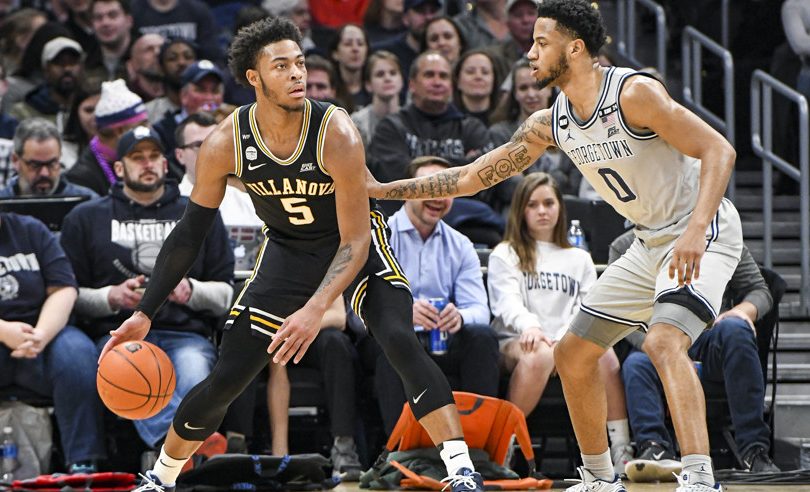
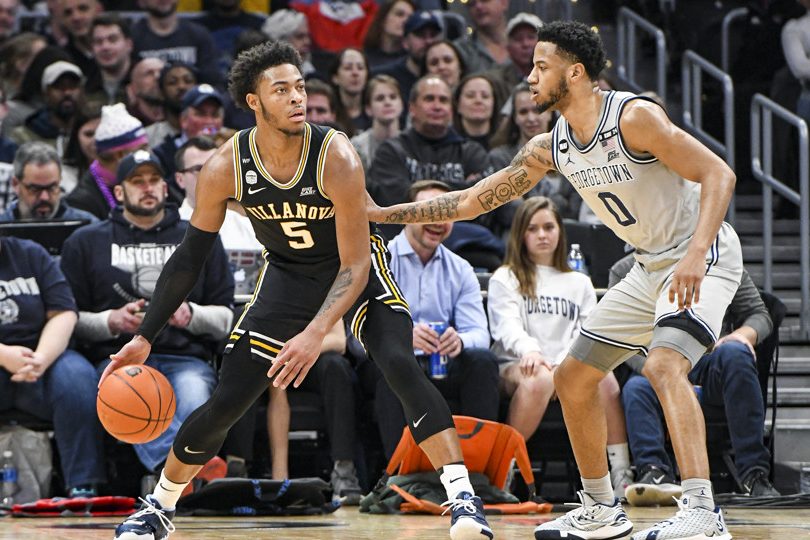
Villanova is one of several teams that should compete for a No. 1 seed (Photo by Mark Goldman/Icon Sportswire)
It’s College Basketball Season Eve! The 2020-21 season is going to be a challenge on many fronts, with games potentially being rescheduled canceled on a regular basis due to the coronavirus.
Despite those challenges, we won’t be deterred from providing our preseason NCAA tournament predictions before the season tips off tomorrow.
How Did We Do With Last Year’s Preseason Bracketology?
Before we get to the preseason 2021 bracket, let’s recap how last year’s preseason bracketology predictions did. Obviously, there was no NCAA Tournament last year, but some conferences did finish their tournaments, and the regular season schedule was completed. We’ll compare our preseason projections to the Bracket Matrix consensus as of the date the 2020 season ended.
1 of 4 top seeds likely correct. Our projected No. 1 seeds last year were Michigan State, Kentucky, Gonzaga and Louisville. Only Gonzaga was likely to be on the #1 line, though the others were all in contention for Top 4 seeds or better heading to conference tournament play. It was also a year with plenty of surprises at the top. Kansas was the only other one in the preseason mix (we had the Jayhawks as a No. 2 seed). Baylor emerged as a No. 1 seed, Dayton had a great year, and San Diego State was also in contention for a top seed.22 of 23 conferences projected correctly as one-bid. The only conference we incorrectly projected as a one-bid league was the Mountain West, where Utah State upsetting San Diego State in the conference title game before the world shut down meant that both would have been in the tournament for sure.8 of 22 one-bid conference champs correct. (Here we’re counting teams that already won their tournaments, or were the lone team from their conference projected in the field at the Bracket Matrix.) Based on our preseason conference tournament win odds, we expected to get an average of 8.3 correct, so 8 is right in line with our expectations. Now, we’ll note that many conferences did not finish their tournaments, and if those had played out, we might have finished a little above or below 8 actually making the field. All three of the teams that we projected as a 12-seed from a one-bid league, by the way, were either already in the field or were the regular season champ when the season ended.35 of 47 at-large quality teams correct. We projected 47 teams above the at-large cutoff line (36 at larges, and 11 projected conference champs). 35 made the final Bracket Matrix consensus. Based on our projected chances for each team to reach the tournament, we’d have expected only about 32 of those 47 teams to make it, so this was a little better than expected. (And surprise conference tournament winners could have reduced this number a bit, bringing it more in line with our expectations.)2 projected top 4 seeds missed the tournament. This is exactly in line with the expectation based on our projected tourney bid odds. The teams we missed were North Carolina (3) and VCU (4). Based on our preseason odds listed for each of the 16 teams, we would have expected 13.8 to make the field and 2.2 to miss.1 actual top 4 seed wasn’t in our preseason bracket: San Diego State (likely a 2 seed) was originally projected to finish behind Utah State in the Mountain West and out of the field, coming out of a conference that typically doesn’t produce more than 1-2 bids recently. But the Aztecs surged after having a 22% chance of reaching the tournament in our 2019-20 preseason projections. While we did not have Dayton (the other surprise contender for a No. 1 seed) as highly as they finished, we did have them projected as a 6 seed, higher than the preseason consensus on the Flyers.West Coast Conference Surge: Gonzaga is a perennial contender from the WCC, but our projections had the West Coast as having three different teams among the Top 6 seed lines, even though the conference hadn’t had three teams in the tournament since 2012 (when the best seed was a No. 7 seed). Those projections panned out, as Gonzaga, BYU and St. Mary’s were all considered safely in the field and likely among the top 8 seeds.
So we weren’t perfect, but we didn’t expect to be — again, these are the results of NCAA tournament predictions we made before the first game of the 2019-20 season was even played. In the end, teams in our preseason bracket should have reached the tournament slightly more often than we expected, and our projections were better for the at-large quality teams than for the automatic bids. Overall, we think we did pretty well for November!
Now, on to our 2021 NCAA tournament projected bracket.
Preseason Projected No. 1 NCAA Seeds In 2021
Here are our projected #1 seeds in the 2021 NCAA tournament:
Gonzaga (53% chance)Kansas (23% chance)Baylor (22% chance)Villanova (21% chance)
Gonzaga is the top team in our preseason ratings, and even though they aren’t significantly above the other three projected No. 1 seeds above in terms of predictive rating, they appear to have the clearest path to putting up enough quality wins and posting a good record that will garner the top seed.
After Gonzaga, there are seven teams that have roughly similar odds of getting a top seed. None of them have even a 25% chance of earning the top seed, but we have to put some teams in those slots, so here are our three most likely candidates.
Kansas is pretty much always in the mix for a top seed, and the 2020-21 season should be no different. The Big 12 is top heavy, which also means plenty of high quality wins available in an otherwise shortened regular season.
Baylor is basically in the same boat as Kansas. Last year, both were likely to be No. 1 seeds when the season ended. They are the top two teams in the Big 12, and that conference has five of the top 11 teams in our predictive power ratings. If those ratings hold up, the Big 12 conference getting two No. 1 seeds isn’t out of the question.
Villanova is our fourth projected No. 1 seed, just ahead of West Virginia, Duke, Virginia, and Michigan State. Villanova’s path is in many ways the opposite of the Big 12 teams. They are expected to be the class of the Big East, a conference that should feature several good (but no other great) teams. That fact could allow Villanova to rack up quality wins against Quad 1 and 2 teams in the NET rankings.
For comparison, last year we had six teams that we gave at least a 28% chance of getting a No. 1 seed. This year, there is only one, so the race for top NCAA seeds should be considered even more wide open in 2020-21 — and that’s before even considering the wackiness that cancellations and schedule changes on account of the pandemic could create.
Now, on to the rest of the bracket…
2021 Projected NCAA Tournament Bracket (Preseason Edition)
(click to enlarge)
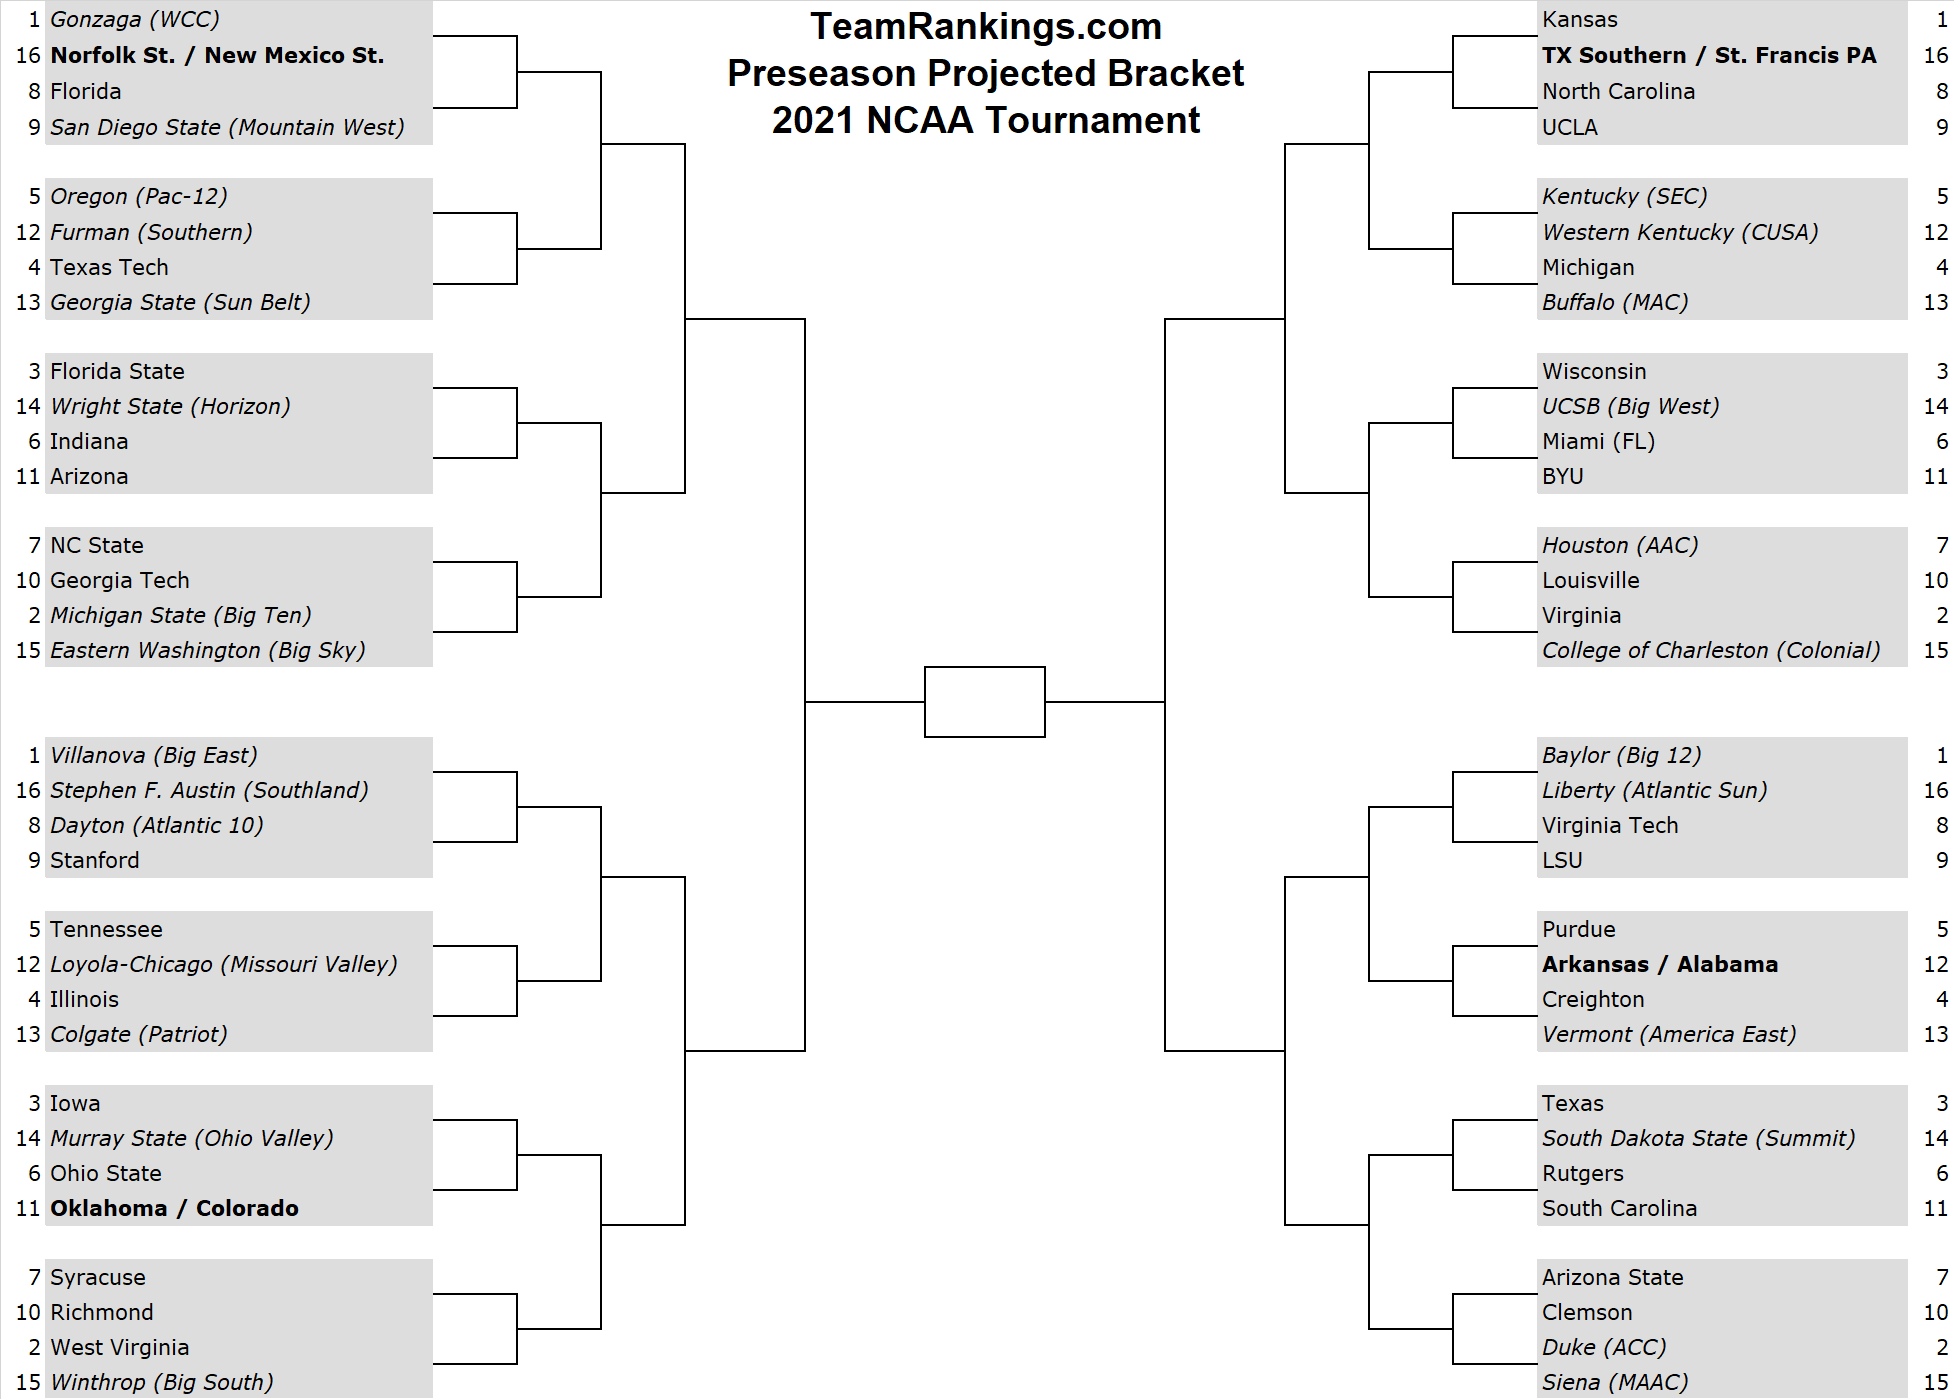
[Note: We’re not worried about following the NCAA’s bracketing rules here. We know that, for example, NC State shouldn’t play Georgia Tech in the first round. Our goal here is to show expected seed lines for each team, and give an idea of the rough quality of opponent they might face in each round. Trying to predict actual bracket matchups at this point is silly.]
For details on how this bracket was created, see our original Madness Strikes November blog post. That post goes into more detail, but the basic idea is:
Simulate the regular seasonSeed and play out the conference tournamentsSimulate the NCAA tournament selection and seeding process
2021 NCAA Bid Odds For All 347 Teams
Our NCAA selection and seeding model doesn’t directly produce the projected bracket you see above. Its output is actually a set of odds describing each team’s chance to make the NCAA tournament, and to earn each specific seed (among other info). The bracket is created at the end, based on those odds but also using a bit of manual intervention to assign teams to specific bracket lines.
What does that mean for you? It means you get to see lots of juicy data, if you so desire. Below you’ll find our official 2021 NCAA tournament preseason projected bracketology odds for every team, but other pages on our site will be updating various odds on a daily basis as each day’s game results come in:
For a sortable table of similar odds that we update daily, check out our NCAA Bracketology detail page.To go a step further and see projected round by round NCAA Tournament advancement odds based on our simulated brackets, check out our NCAA Tournament Bracket Predictions.
Some Final Tips For Understanding Our Bracketology Odds
You might notice in the gigantic, 347-row table below that some power conferences have more teams projected in the field than others. For example, the Atlantic Coast has 11 teams in the projected field, while the Big East only has two.
Does that mean we expect 11 teams from the ACC Tournament to be in the tournament, and the Big East to get only two? No. But when projecting individual teams, several ACC teams have percentage chances just above the cutline, and several Big East teams are just below it.
For comparison, here is the number of teams appearing in the at-large bid range in the gigantic table (the top 47 teams, 37 at-larges plus 10 auto bids), versus the number of teams we expect from each conference when we add up each individual team’s chances of making the tournament:
| Conference | Preseason Field | Expected |
|---|---|---|
| ACC | 11 | 7.2 |
| Big Ten | 9 | 7.0 |
| SEC | 7 | 5.8 |
| Big 12 | 6 | 5.5 |
| Pac 12 | 6 | 4.9 |
| Big East | 2 | 4.2 |
| Atlantic 10 | 2 | 3.2 |
| West Coast | 2 | 2.3 |
| American | 1 | 2.7 |
| Mountain West | 1 | 1.9 |
| TOTAL | 47 | 44.7 |
So if you ask us how many teams will make the tournament from the ACC, and how many will make it from the Big East, we would say about 7, and about 4, respectively.
But if you asked us to project the specific field by individual teams with the best chances, we would have a few more ACC teams and a few less Big East teams. That’s because nailing the identity of the specific Big East teams is a little more unlikely outside of Creighton and Villanova, with several teams with odds between 25% and 35% each.
Without Further Ado…
Here are our 2020-21 preseason bracketology odds for every team:
| TR Bracket Seed | Team | Bid | Auto | At Large | Avg Seed If In | 1-4 Seed | 1 Seed |
|---|---|---|---|---|---|---|---|
| 1 | Gonzaga | 98% | 70% | 28% | 2.4 | 84% | 53% |
| 1 | Kansas | 95% | 22% | 73% | 4.7 | 55% | 23% |
| 1 | Baylor | 93% | 22% | 70% | 4.6 | 55% | 22% |
| 1 | Villanova | 92% | 39% | 54% | 3.9 | 62% | 21% |
| 2 | W Virginia | 92% | 18% | 74% | 4.7 | 54% | 21% |
| 2 | Duke | 89% | 22% | 67% | 4.5 | 53% | 20% |
| 2 | Virginia | 90% | 21% | 70% | 4.7 | 52% | 20% |
| 2 | Michigan St | 84% | 17% | 67% | 4.7 | 47% | 16% |
| 3 | Wisconsin | 77% | 15% | 62% | 4.8 | 42% | 12% |
| 3 | Florida St | 74% | 12% | 61% | 5.0 | 38% | 12% |
| 3 | Iowa | 84% | 15% | 69% | 5.2 | 44% | 13% |
| 3 | Texas | 88% | 15% | 73% | 5.6 | 42% | 14% |
| 4 | Creighton | 78% | 22% | 56% | 5.3 | 38% | 9% |
| 4 | Michigan | 65% | 9% | 56% | 5.2 | 31% | 7% |
| 4 | Texas Tech | 86% | 14% | 71% | 5.9 | 38% | 11% |
| 4 | Illinois | 71% | 11% | 60% | 5.7 | 31% | 8% |
| 5 | Oregon | 79% | 21% | 58% | 5.8 | 34% | 7% |
| 5 | Kentucky | 80% | 19% | 61% | 6.0 | 34% | 9% |
| 5 | Tennessee | 75% | 17% | 57% | 6.0 | 30% | 6% |
| 5 | Purdue | 53% | 6% | 48% | 6.0 | 20% | 4% |
| 6 | Ohio State | 58% | 8% | 50% | 6.0 | 22% | 4% |
| 6 | Rutgers | 42% | 4% | 38% | 6.0 | 15% | 3% |
| 6 | Miami (FL) | 44% | 4% | 40% | 6.1 | 16% | 3% |
| 6 | Indiana | 61% | 7% | 54% | 6.3 | 22% | 5% |
| 7 | NC State | 45% | 4% | 40% | 6.4 | 15% | 3% |
| 7 | Houston | 79% | 34% | 44% | 6.6 | 26% | 3% |
| 7 | Syracuse | 44% | 4% | 40% | 6.8 | 13% | 2% |
| 7 | Arizona St | 61% | 14% | 47% | 6.8 | 18% | 2% |
| 8 | Dayton | 56% | 18% | 38% | 6.9 | 15% | 1% |
| 8 | VA Tech | 41% | 4% | 37% | 6.9 | 12% | 2% |
| 8 | Florida | 78% | 16% | 62% | 6.8 | 27% | 6% |
| 8 | N Carolina | 72% | 9% | 63% | 6.7 | 25% | 6% |
| 9 | Stanford | 56% | 13% | 44% | 7.1 | 15% | 2% |
| 9 | UCLA | 67% | 15% | 52% | 7.0 | 20% | 3% |
| 9 | San Diego St | 63% | 32% | 31% | 7.5 | 14% | 1% |
| 9 | LSU | 58% | 9% | 48% | 7.2 | 16% | 2% |
| 10 | Clemson | 49% | 4% | 45% | 7.3 | 13% | 2% |
| 10 | Richmond | 57% | 16% | 41% | 7.5 | 13% | 2% |
| 10 | Louisville | 66% | 7% | 59% | 7.1 | 20% | 4% |
| 10 | GA Tech | 47% | 4% | 43% | 7.4 | 12% | 2% |
| 11 | Arizona | 50% | 9% | 41% | 7.7 | 11% | 1% |
| 11 | BYU | 54% | 13% | 41% | 7.7 | 11% | 1% |
| 11 | S Carolina | 51% | 7% | 44% | 7.6 | 12% | 2% |
| 11 | Oklahoma | 55% | 5% | 50% | 7.3 | 15% | 3% |
| 11 | Colorado | 43% | 8% | 36% | 8.0 | 8% | 1% |
| 12 | Arkansas | 41% | 6% | 36% | 7.9 | 8% | 1% |
| 12 | Alabama | 50% | 6% | 43% | 7.8 | 11% | 2% |
| 12 | Loyola-Chi | 56% | 35% | 21% | 8.1 | 9% | 0% |
| 12 | W Kentucky | 40% | 20% | 19% | 8.3 | 6% | 0% |
| 12 | Furman | 60% | 40% | 21% | 8.8 | 8% | 0% |
| 13 | Georgia St | 35% | 29% | 6% | 10.6 | 2% | 0% |
| 13 | Buffalo | 28% | 20% | 7% | 11.0 | 1% | 0% |
| 13 | Vermont | 59% | 57% | 2% | 11.9 | 1% | 0% |
| 13 | Colgate | 33% | 33% | 0% | 12.8 | 0% | 0% |
| 14 | Murray St | 33% | 32% | 1% | 13.2 | 0% | 0% |
| 14 | S Dakota St | 50% | 48% | 2% | 13.2 | 0% | 0% |
| 14 | UCSB | 29% | 28% | 1% | 13.3 | 0% | 0% |
| 14 | Wright State | 34% | 33% | 1% | 13.4 | 0% | 0% |
| 15 | E Washingtn | 33% | 32% | 1% | 13.4 | 0% | 0% |
| 15 | Col Charlestn | 19% | 18% | 1% | 13.2 | 0% | 0% |
| 15 | Siena | 20% | 20% | 0% | 13.7 | 0% | 0% |
| 15 | Winthrop | 54% | 54% | 0% | 13.8 | 0% | 0% |
| 16 | Ste F Austin | 37% | 37% | 0% | 14.5 | 0% | 0% |
| 16 | Liberty | 35% | 35% | 0% | 14.6 | 0% | 0% |
| 16 | TX Southern | 30% | 30% | 0% | 15.8 | 0% | 0% |
| 16 | Norfolk St | 32% | 32% | 0% | 15.6 | 0% | 0% |
| 16 | N Mex State | 51% | 51% | 0% | 14.2 | 0% | 0% |
| 16 | St Fran (PA) | 20% | 20% | 0% | 15.4 | 0% | 0% |
| N Iowa | 51% | 27% | 24% | 8.1 | 9% | 1% | |
| Memphis | 46% | 16% | 31% | 7.9 | 8% | 1% | |
| Cincinnati | 46% | 14% | 32% | 8.1 | 8% | 1% | |
| Saint Louis | 42% | 15% | 27% | 6.7 | 12% | 1% | |
| NC-Grnsboro | 40% | 29% | 11% | 9.4 | 4% | 0% | |
| Utah State | 40% | 20% | 19% | 8.4 | 6% | 0% | |
| Seton Hall | 39% | 6% | 33% | 7.5 | 9% | 1% | |
| S Methodist | 38% | 14% | 25% | 8.6 | 5% | 0% | |
| Missouri | 38% | 5% | 33% | 7.7 | 8% | 1% | |
| Minnesota | 37% | 3% | 34% | 6.4 | 12% | 2% | |
| Utah | 36% | 6% | 30% | 8.1 | 6% | 1% | |
| Marquette | 36% | 6% | 30% | 7.4 | 8% | 1% | |
| Providence | 36% | 6% | 30% | 7.3 | 8% | 1% | |
| Boise State | 36% | 15% | 20% | 9.4 | 3% | 0% | |
| Washington | 35% | 6% | 30% | 8.1 | 6% | 0% | |
| USC | 35% | 6% | 29% | 8.0 | 6% | 1% | |
| St Marys | 34% | 6% | 28% | 8.5 | 5% | 0% | |
| Maryland | 34% | 3% | 31% | 6.5 | 10% | 1% | |
| Marshall | 34% | 16% | 17% | 8.4 | 5% | 0% | |
| Belmont | 33% | 32% | 0% | 13.6 | 0% | 0% | |
| Mississippi | 32% | 4% | 28% | 7.6 | 7% | 1% | |
| Notre Dame | 32% | 2% | 30% | 7.7 | 7% | 1% | |
| Rhode Island | 32% | 10% | 22% | 7.9 | 6% | 0% | |
| Duquesne | 31% | 8% | 23% | 7.7 | 6% | 0% | |
| St Bonavent | 31% | 10% | 21% | 7.2 | 7% | 1% | |
| Connecticut | 29% | 5% | 24% | 7.4 | 6% | 1% | |
| Butler | 29% | 5% | 24% | 7.4 | 6% | 1% | |
| Xavier | 28% | 4% | 24% | 7.8 | 5% | 1% | |
| Davidson | 27% | 10% | 17% | 8.0 | 4% | 0% | |
| Grd Canyon | 26% | 26% | 0% | 15.0 | 0% | 0% | |
| UC Irvine | 26% | 25% | 0% | 13.3 | 0% | 0% | |
| San Fransco | 24% | 5% | 19% | 8.2 | 3% | 0% | |
| Old Dominion | 23% | 12% | 11% | 8.8 | 3% | 0% | |
| Lipscomb | 23% | 23% | 0% | 14.9 | 0% | 0% | |
| LA Tech | 23% | 13% | 10% | 9.5 | 2% | 0% | |
| Boston U | 23% | 23% | 0% | 13.4 | 0% | 0% | |
| Texas A&M | 22% | 3% | 19% | 8.4 | 3% | 0% | |
| VCU | 22% | 6% | 16% | 8.8 | 3% | 0% | |
| NC Central | 22% | 22% | 0% | 15.7 | 0% | 0% | |
| TX Christian | 21% | 1% | 19% | 9.0 | 3% | 0% | |
| North Texas | 21% | 11% | 10% | 9.5 | 2% | 0% | |
| Indiana St | 20% | 12% | 9% | 10.0 | 1% | 0% | |
| St Johns | 20% | 3% | 17% | 8.2 | 3% | 0% | |
| Wichita St | 20% | 7% | 13% | 9.0 | 2% | 0% | |
| Abl Christian | 20% | 20% | 0% | 14.9 | 0% | 0% | |
| Penn State | 20% | 1% | 19% | 7.6 | 4% | 0% | |
| DePaul | 19% | 3% | 16% | 7.7 | 3% | 0% | |
| Miss State | 19% | 2% | 17% | 7.9 | 3% | 0% | |
| Colorado St | 19% | 8% | 10% | 10.3 | 1% | 0% | |
| Auburn | 18% | 2% | 16% | 8.8 | 2% | 0% | |
| F Dickinson | 18% | 18% | 0% | 15.4 | 0% | 0% | |
| Ball State | 17% | 14% | 3% | 11.3 | 0% | 0% | |
| AR Lit Rock | 17% | 14% | 3% | 11.6 | 1% | 0% | |
| Montana | 17% | 17% | 0% | 14.2 | 0% | 0% | |
| Akron | 17% | 14% | 3% | 11.2 | 1% | 0% | |
| Georgia | 17% | 2% | 15% | 8.8 | 2% | 0% | |
| S Florida | 17% | 5% | 11% | 9.4 | 1% | 0% | |
| Fla Gulf Cst | 16% | 16% | 0% | 15.0 | 0% | 0% | |
| N Kentucky | 16% | 16% | 0% | 14.1 | 0% | 0% | |
| Monmouth | 16% | 16% | 0% | 14.1 | 0% | 0% | |
| Iowa State | 16% | 1% | 15% | 8.8 | 2% | 0% | |
| Mt St Marys | 16% | 16% | 0% | 15.5 | 0% | 0% | |
| Southern | 16% | 16% | 0% | 15.9 | 0% | 0% | |
| Pittsburgh | 16% | 1% | 15% | 6.5 | 5% | 1% | |
| Texas State | 15% | 14% | 1% | 12.8 | 0% | 0% | |
| N Florida | 15% | 15% | 0% | 15.2 | 0% | 0% | |
| Austin Peay | 15% | 15% | 0% | 14.1 | 0% | 0% | |
| St Peters | 15% | 15% | 0% | 14.2 | 0% | 0% | |
| NC A&T | 15% | 15% | 0% | 15.9 | 0% | 0% | |
| UAB | 15% | 9% | 5% | 10.5 | 1% | 0% | |
| LIU | 14% | 14% | 0% | 15.4 | 0% | 0% | |
| Grambling St | 14% | 14% | 0% | 15.9 | 0% | 0% | |
| Bradley | 14% | 9% | 5% | 10.6 | 1% | 0% | |
| Towson | 14% | 13% | 0% | 13.9 | 0% | 0% | |
| Northeastrn | 13% | 13% | 0% | 14.0 | 0% | 0% | |
| Jackson St | 13% | 13% | 0% | 15.9 | 0% | 0% | |
| UNLV | 13% | 9% | 4% | 10.7 | 0% | 0% | |
| NC-Asheville | 13% | 13% | 0% | 15.2 | 0% | 0% | |
| Prairie View | 13% | 13% | 0% | 16.0 | 0% | 0% | |
| California | 13% | 2% | 11% | 9.1 | 1% | 0% | |
| TX-Arlington | 13% | 11% | 1% | 12.5 | 0% | 0% | |
| Canisius | 13% | 12% | 0% | 14.2 | 0% | 0% | |
| Central FL | 12% | 4% | 8% | 9.8 | 1% | 0% | |
| Hofstra | 12% | 12% | 0% | 13.4 | 0% | 0% | |
| N Dakota St | 12% | 12% | 0% | 14.8 | 0% | 0% | |
| Nevada | 12% | 7% | 5% | 10.4 | 0% | 0% | |
| Wofford | 12% | 10% | 2% | 11.5 | 0% | 0% | |
| Drexel | 12% | 12% | 0% | 14.2 | 0% | 0% | |
| Oral Roberts | 12% | 12% | 0% | 14.7 | 0% | 0% | |
| Ohio | 12% | 11% | 1% | 12.5 | 0% | 0% | |
| Georgetown | 12% | 2% | 10% | 8.3 | 2% | 0% | |
| Navy | 11% | 11% | 0% | 14.4 | 0% | 0% | |
| Toledo | 11% | 10% | 1% | 12.6 | 0% | 0% | |
| N Colorado | 11% | 11% | 0% | 14.6 | 0% | 0% | |
| Northwestern | 11% | 1% | 10% | 7.7 | 2% | 0% | |
| Nicholls St | 11% | 11% | 0% | 15.3 | 0% | 0% | |
| Sacred Hrt | 11% | 11% | 0% | 15.5 | 0% | 0% | |
| Geo Mason | 10% | 4% | 7% | 9.1 | 1% | 0% | |
| S Utah | 10% | 10% | 0% | 14.5 | 0% | 0% | |
| E Illinois | 10% | 10% | 0% | 14.7 | 0% | 0% | |
| Hawaii | 10% | 10% | 0% | 14.2 | 0% | 0% | |
| CS Bakersfld | 10% | 10% | 0% | 14.4 | 0% | 0% | |
| Iona | 10% | 10% | 0% | 14.4 | 0% | 0% | |
| IPFW | 10% | 10% | 0% | 14.6 | 0% | 0% | |
| Tulsa | 9% | 4% | 6% | 9.5 | 1% | 0% | |
| Bowling Grn | 9% | 8% | 1% | 12.4 | 0% | 0% | |
| Utah Val St | 9% | 9% | 0% | 15.4 | 0% | 0% | |
| Morgan St | 9% | 9% | 0% | 15.9 | 0% | 0% | |
| South Dakota | 9% | 9% | 0% | 14.9 | 0% | 0% | |
| Bucknell | 9% | 9% | 0% | 13.8 | 0% | 0% | |
| UC Riverside | 9% | 9% | 0% | 14.4 | 0% | 0% | |
| Neb Omaha | 9% | 9% | 0% | 14.8 | 0% | 0% | |
| Maryland BC | 9% | 9% | 0% | 14.3 | 0% | 0% | |
| Oregon St | 9% | 1% | 7% | 8.9 | 1% | 0% | |
| Pepperdine | 9% | 2% | 7% | 9.0 | 1% | 0% | |
| TX-Pan Am | 9% | 9% | 0% | 15.5 | 0% | 0% | |
| James Mad | 8% | 8% | 0% | 14.1 | 0% | 0% | |
| St Fran (NY) | 8% | 8% | 0% | 15.5 | 0% | 0% | |
| Coastal Car | 8% | 7% | 1% | 12.5 | 0% | 0% | |
| N Hampshire | 8% | 8% | 0% | 14.0 | 0% | 0% | |
| Lamar | 8% | 8% | 0% | 15.4 | 0% | 0% | |
| UC Davis | 8% | 8% | 0% | 14.7 | 0% | 0% | |
| Coppin State | 8% | 8% | 0% | 15.9 | 0% | 0% | |
| Gard-Webb | 8% | 8% | 0% | 15.4 | 0% | 0% | |
| Florida A&M | 8% | 8% | 0% | 15.9 | 0% | 0% | |
| Campbell | 7% | 7% | 0% | 15.5 | 0% | 0% | |
| Wake Forest | 7% | 0% | 7% | 8.7 | 1% | 0% | |
| Montana St | 7% | 7% | 0% | 14.7 | 0% | 0% | |
| S Alabama | 7% | 7% | 0% | 13.0 | 0% | 0% | |
| E Michigan | 7% | 6% | 1% | 12.6 | 0% | 0% | |
| IL-Chicago | 7% | 7% | 0% | 14.6 | 0% | 0% | |
| Portland St | 7% | 7% | 0% | 14.6 | 0% | 0% | |
| Bryant | 7% | 7% | 0% | 15.6 | 0% | 0% | |
| Boston Col | 7% | 0% | 6% | 6.6 | 2% | 0% | |
| Stony Brook | 7% | 7% | 0% | 14.5 | 0% | 0% | |
| Chattanooga | 7% | 6% | 1% | 12.3 | 0% | 0% | |
| Valparaiso | 7% | 5% | 2% | 11.4 | 0% | 0% | |
| Lafayette | 6% | 6% | 0% | 14.0 | 0% | 0% | |
| American | 6% | 6% | 0% | 14.2 | 0% | 0% | |
| Youngs St | 6% | 6% | 0% | 14.5 | 0% | 0% | |
| Wm & Mary | 6% | 6% | 0% | 14.5 | 0% | 0% | |
| McNeese St | 6% | 6% | 0% | 15.3 | 0% | 0% | |
| Vanderbilt | 6% | 1% | 6% | 9.6 | 0% | 0% | |
| Kansas St | 6% | 0% | 6% | 9.7 | 0% | 0% | |
| Alcorn State | 6% | 6% | 0% | 16.0 | 0% | 0% | |
| Elon | 6% | 6% | 0% | 14.5 | 0% | 0% | |
| Delaware | 6% | 6% | 0% | 14.4 | 0% | 0% | |
| Rob Morris | 6% | 6% | 0% | 14.5 | 0% | 0% | |
| WI-Grn Bay | 6% | 6% | 0% | 14.7 | 0% | 0% | |
| Miami (OH) | 6% | 5% | 1% | 12.8 | 0% | 0% | |
| NC-Wilmgton | 6% | 6% | 0% | 14.5 | 0% | 0% | |
| NJIT | 6% | 6% | 0% | 14.3 | 0% | 0% | |
| Sam Hous St | 6% | 6% | 0% | 15.2 | 0% | 0% | |
| E Tenn St | 6% | 5% | 1% | 12.2 | 0% | 0% | |
| Stetson | 6% | 6% | 0% | 15.4 | 0% | 0% | |
| Oakland | 5% | 5% | 0% | 14.8 | 0% | 0% | |
| Loyola Mymt | 5% | 1% | 4% | 9.1 | 0% | 0% | |
| Fairfield | 5% | 5% | 0% | 14.8 | 0% | 0% | |
| Florida Intl | 5% | 4% | 1% | 10.6 | 0% | 0% | |
| Sac State | 5% | 5% | 0% | 14.9 | 0% | 0% | |
| Niagara | 5% | 5% | 0% | 14.7 | 0% | 0% | |
| Kent State | 5% | 5% | 1% | 13.0 | 0% | 0% | |
| Radford | 5% | 5% | 0% | 15.6 | 0% | 0% | |
| Drake | 5% | 4% | 1% | 11.7 | 0% | 0% | |
| TX-San Ant | 5% | 4% | 1% | 10.9 | 0% | 0% | |
| Wagner | 5% | 5% | 0% | 15.6 | 0% | 0% | |
| Jacksonville | 5% | 5% | 0% | 15.6 | 0% | 0% | |
| Rider | 5% | 5% | 0% | 14.7 | 0% | 0% | |
| Seattle | 5% | 5% | 0% | 15.7 | 0% | 0% | |
| LA Lafayette | 5% | 5% | 0% | 12.9 | 0% | 0% | |
| U Mass | 5% | 2% | 3% | 8.6 | 1% | 0% | |
| App State | 5% | 5% | 0% | 13.8 | 0% | 0% | |
| Manhattan | 5% | 5% | 0% | 14.9 | 0% | 0% | |
| Lg Beach St | 5% | 5% | 0% | 14.9 | 0% | 0% | |
| Mass Lowell | 5% | 5% | 0% | 14.6 | 0% | 0% | |
| Weber State | 5% | 5% | 0% | 14.9 | 0% | 0% | |
| W Carolina | 4% | 4% | 0% | 13.0 | 0% | 0% | |
| Lehigh | 4% | 4% | 0% | 14.5 | 0% | 0% | |
| Hartford | 4% | 4% | 0% | 14.6 | 0% | 0% | |
| Mercer | 4% | 4% | 0% | 13.0 | 0% | 0% | |
| S Illinois | 4% | 3% | 1% | 11.7 | 0% | 0% | |
| TX El Paso | 4% | 3% | 1% | 10.6 | 0% | 0% | |
| Missouri St | 4% | 3% | 1% | 12.3 | 0% | 0% | |
| North Dakota | 4% | 4% | 0% | 15.3 | 0% | 0% | |
| Albany | 4% | 4% | 0% | 14.5 | 0% | 0% | |
| Wyoming | 4% | 3% | 1% | 12.0 | 0% | 0% | |
| N Illinois | 4% | 4% | 0% | 13.7 | 0% | 0% | |
| Charl South | 4% | 4% | 0% | 15.6 | 0% | 0% | |
| Santa Clara | 4% | 1% | 3% | 9.6 | 0% | 0% | |
| Alab A&M | 4% | 4% | 0% | 16.0 | 0% | 0% | |
| Loyola-MD | 4% | 4% | 0% | 14.4 | 0% | 0% | |
| New Mexico | 3% | 2% | 1% | 10.9 | 0% | 0% | |
| Middle Tenn | 3% | 2% | 1% | 10.7 | 0% | 0% | |
| E Kentucky | 3% | 3% | 0% | 14.9 | 0% | 0% | |
| SC Upstate | 3% | 3% | 0% | 15.6 | 0% | 0% | |
| UMKC | 3% | 3% | 0% | 15.2 | 0% | 0% | |
| Central Ark | 3% | 3% | 0% | 15.3 | 0% | 0% | |
| Detroit | 3% | 3% | 0% | 15.0 | 0% | 0% | |
| Temple | 3% | 1% | 2% | 10.8 | 0% | 0% | |
| Quinnipiac | 3% | 3% | 0% | 15.1 | 0% | 0% | |
| Arkansas St | 3% | 3% | 0% | 13.5 | 0% | 0% | |
| Marist | 3% | 3% | 0% | 14.9 | 0% | 0% | |
| N Arizona | 3% | 3% | 0% | 15.1 | 0% | 0% | |
| CS Fullerton | 3% | 3% | 0% | 15.0 | 0% | 0% | |
| Army | 3% | 3% | 0% | 14.6 | 0% | 0% | |
| WI-Milwkee | 3% | 3% | 0% | 14.9 | 0% | 0% | |
| TX A&M-CC | 3% | 3% | 0% | 15.5 | 0% | 0% | |
| Howard | 3% | 3% | 0% | 16.0 | 0% | 0% | |
| Fresno St | 3% | 2% | 1% | 12.0 | 0% | 0% | |
| Cleveland St | 3% | 3% | 0% | 14.9 | 0% | 0% | |
| New Orleans | 3% | 3% | 0% | 15.5 | 0% | 0% | |
| GA Southern | 3% | 2% | 0% | 13.6 | 0% | 0% | |
| Jksnville St | 3% | 2% | 0% | 14.8 | 0% | 0% | |
| Pacific | 2% | 1% | 2% | 9.6 | 0% | 0% | |
| Illinois St | 2% | 2% | 0% | 12.4 | 0% | 0% | |
| NW State | 2% | 2% | 0% | 15.7 | 0% | 0% | |
| Charlotte | 2% | 2% | 1% | 10.3 | 0% | 0% | |
| S Car State | 2% | 2% | 0% | 16.0 | 0% | 0% | |
| Ark Pine Bl | 2% | 2% | 0% | 16.0 | 0% | 0% | |
| Alabama St | 2% | 2% | 0% | 16.0 | 0% | 0% | |
| Fla Atlantic | 2% | 2% | 1% | 11.2 | 0% | 0% | |
| E Carolina | 2% | 1% | 1% | 10.6 | 0% | 0% | |
| Denver | 2% | 2% | 0% | 15.5 | 0% | 0% | |
| Delaware St | 2% | 2% | 0% | 16.0 | 0% | 0% | |
| W Michigan | 2% | 2% | 0% | 13.9 | 0% | 0% | |
| Idaho State | 2% | 2% | 0% | 15.3 | 0% | 0% | |
| San Diego | 2% | 1% | 1% | 9.6 | 0% | 0% | |
| Central Mich | 2% | 2% | 0% | 13.8 | 0% | 0% | |
| TN State | 2% | 2% | 0% | 14.9 | 0% | 0% | |
| Hampton | 2% | 2% | 0% | 15.7 | 0% | 0% | |
| High Point | 2% | 2% | 0% | 15.7 | 0% | 0% | |
| IUPUI | 2% | 2% | 0% | 15.0 | 0% | 0% | |
| Longwood | 1% | 1% | 0% | 15.8 | 0% | 0% | |
| SE Louisiana | 1% | 1% | 0% | 15.5 | 0% | 0% | |
| Cal Poly | 1% | 1% | 0% | 15.4 | 0% | 0% | |
| Morehead St | 1% | 1% | 0% | 15.3 | 0% | 0% | |
| Cal St Nrdge | 1% | 1% | 0% | 15.3 | 0% | 0% | |
| St Josephs | 1% | 0% | 1% | 10.7 | 0% | 0% | |
| La Salle | 1% | 1% | 0% | 10.6 | 0% | 0% | |
| LA Monroe | 1% | 1% | 0% | 14.5 | 0% | 0% | |
| Central Conn | 1% | 1% | 0% | 15.9 | 0% | 0% | |
| Nebraska | 1% | 0% | 1% | 8.0 | 0% | 0% | |
| Wash State | 1% | 0% | 1% | 9.9 | 0% | 0% | |
| Geo Wshgtn | 1% | 0% | 0% | 9.9 | 0% | 0% | |
| Idaho | 1% | 1% | 0% | 15.5 | 0% | 0% | |
| W Illinois | 1% | 1% | 0% | 15.6 | 0% | 0% | |
| Troy | 1% | 1% | 0% | 14.8 | 0% | 0% | |
| Samford | 1% | 1% | 0% | 14.6 | 0% | 0% | |
| VA Military | 1% | 1% | 0% | 14.2 | 0% | 0% | |
| Air Force | 1% | 1% | 0% | 13.0 | 0% | 0% | |
| Rice | 1% | 1% | 0% | 12.7 | 0% | 0% | |
| SE Missouri | 1% | 1% | 0% | 15.3 | 0% | 0% | |
| Presbyterian | 1% | 1% | 0% | 15.9 | 0% | 0% | |
| S Mississippi | 1% | 1% | 0% | 13.2 | 0% | 0% | |
| TN Tech | 0% | 0% | 0% | 15.3 | 0% | 0% | |
| Miss Val St | 0% | 0% | 0% | 16.0 | 0% | 0% | |
| Evansville | 0% | 0% | 0% | 14.0 | 0% | 0% | |
| Binghamton | 0% | 0% | 0% | 15.5 | 0% | 0% | |
| Holy Cross | 0% | 0% | 0% | 14.7 | 0% | 0% | |
| TN Martin | 0% | 0% | 0% | 15.4 | 0% | 0% | |
| Houston Bap | 0% | 0% | 0% | 15.9 | 0% | 0% | |
| Maine | 0% | 0% | 0% | 15.5 | 0% | 0% | |
| Tulane | 0% | 0% | 0% | 12.4 | 0% | 0% | |
| Citadel | 0% | 0% | 0% | 15.0 | 0% | 0% | |
| Incar Word | 0% | 0% | 0% | 15.9 | 0% | 0% | |
| San Jose St | 0% | 0% | 0% | 12.7 | 0% | 0% | |
| Fordham | 0% | 0% | 0% | 12.4 | 0% | 0% | |
| SIU Edward | 0% | 0% | 0% | 15.3 | 0% | 0% | |
| Kennesaw St | 0% | 0% | 0% | 15.8 | 0% | 0% | |
| Chicago St | 0% | 0% | 0% | 16.0 | 0% | 0% | |
| Portland | 0% | 0% | 0% | 9.2 | 0% | 0% | |
| California Baptist | 0% | 0% | 0% | 0.0 | 0% | 0% | |
| Tarleton State | 0% | 0% | 0% | 0.0 | 0% | 0% | |
| Merrimack | 0% | 0% | 0% | 0.0 | 0% | 0% | |
| North Alabama | 0% | 0% | 0% | 0.0 | 0% | 0% | |
| Oklahoma St | 0% | 0% | 0% | 0.0 | 0% | 0% | |
| UC San Diego | 0% | 0% | 0% | 0.0 | 0% | 0% | |
| Dixie State | 0% | 0% | 0% | 0.0 | 0% | 0% | |
| Bellarmine | 0% | 0% | 0% | 0.0 | 0% | 0% |
If you liked this post, please share it. Thank you! Twitter Facebook
NFL Football Pool Picks NFL Survivor Pool Picks NCAA Bracket Picks College Bowl Pool Picks College Football Pool Picks NFL Picks NBA Picks MLB Picks College Football Picks College Basketball Picks NFL Predictions NBA Predictions MLB Predictions College Football Predictions College Basketball Predictions NFL Spread Picks NBA Spread Picks MLB Spread Picks College Football Spread Picks College Basketball Spread Picks NFL Rankings NBA Rankings MLB Rankings College Football Rankings College Basketball Rankings NFL Stats NBA Stats MLB Stats College Football Stats College Basketball Stats NFL Odds NBA Odds MLB Odds College Football Odds College Basketball Odds A product ofTeamRankings BlogAboutTeamJobsContact
© 2005-2024 Team Rankings, LLC. All Rights Reserved. Statistical data provided by Gracenote.
TeamRankings.com is not affiliated with the National Collegiate Athletic Association (NCAA®) or March Madness Athletic Association, neither of which has supplied, reviewed, approved or endorsed the material on this site. TeamRankings.com is solely responsible for this site but makes no guarantee about the accuracy or completeness of the information herein.
Terms of ServicePrivacy Policy