College Football Preseason Rankings 2019: Clemson, Alabama Lead The Way
August 22, 2019 – by David Hess
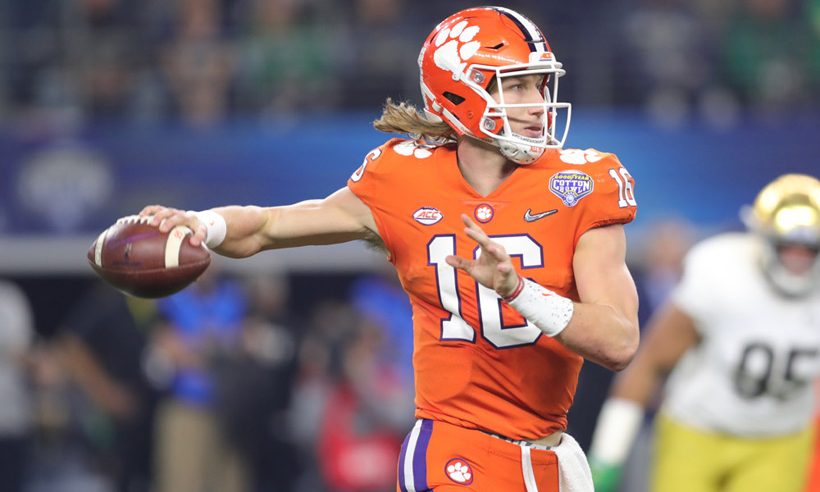
Here are the official TeamRankings 2019 college football preseason rankings and predictive ratings.
If you’d like to learn about the methodology behind our mostly data-driven preseason team ratings, make sure your read our post on How We Make College Football Preseason Rankings.
If you just want to see the 2019 rankings, keep reading to find out how good (or bad) we expect all 130 FBS teams to be this year, starting with the TR Top 25.
NFL Week 1 Picks
Content:
ToggleBetting – Survivor – Pick’em
Start Free TrialGet The Season
The 2019 TeamRankings College Football Preseason Top 25
Jump to rankings for all 130 FBS teams
The table below presents our 25 highest ranked teams in the preseason (e.g. Clemson at No. 1), along with their associated preseason predictive ratings (e.g. 30.9 for Clemson).
The final five columns of the table show the relative contribution that specific predictive factors and our “market adjustment” made to our final preseason rating for each team. We’ll explain those more below.
| TR Rank | Team | 2019 Rating | LAST YEAR | PROGRAM | RETURN | LUCK | MARKET |
|---|---|---|---|---|---|---|---|
| 1 | Clemson | 30.9 | 25.1 | 5.2 | 0.7 | -1.5 | 1.5 |
| 2 | Alabama | 30.8 | 23.7 | 6.2 | 0.1 | -1.6 | 2.5 |
| 3 | Georgia | 28.0 | 17.0 | 2.0 | 5.7 | 0.9 | 2.5 |
| 4 | Michigan | 25.3 | 14.7 | 4.3 | 0.7 | 0.1 | 5.5 |
| 5 | Ohio State | 22.9 | 14.2 | 5.3 | -4.1 | 0.5 | 7.0 |
| 6 | Louisiana State | 20.8 | 11.6 | 3.4 | 4.3 | -1.0 | 2.5 |
| 7 | Oklahoma | 20.5 | 15.1 | 4.9 | -1.7 | 1.1 | 1.0 |
| 8 | Florida | 19.3 | 11.7 | 1.9 | 4.0 | -1.3 | 3.0 |
| 9 | Notre Dame | 18.8 | 12.6 | 2.8 | 0.1 | -1.2 | 4.5 |
| 10 | Texas A&M | 16.9 | 12.1 | 2.0 | 0.7 | 0.7 | 1.5 |
| 11 | Auburn | 16.8 | 11.1 | 2.6 | -1.9 | -0.5 | 5.5 |
| 12 | Washington | 16.6 | 9.2 | 4.1 | -2.5 | -0.3 | 6.0 |
| 13 | Penn State | 15.6 | 12.1 | 2.3 | -2.6 | -0.8 | 4.5 |
| 14 | Michigan State | 15.3 | 4.7 | 1.7 | 4.2 | -0.3 | 5.0 |
| 15 | Oregon | 15.1 | 4.5 | 1.1 | 3.1 | -0.6 | 7.0 |
| 16 | Utah | 15.0 | 8.1 | 2.1 | 4.6 | -1.7 | 2.0 |
| 17 | Wisconsin | 14.6 | 6.2 | 3.2 | 3.4 | -0.1 | 2.0 |
| 18 | Texas | 13.3 | 8.6 | 0.8 | -1.9 | -1.2 | 7.0 |
| 19 | Mississippi State | 13.1 | 14.2 | 2.1 | -1.5 | -1.6 | 0.0 |
| 20 | Iowa | 12.7 | 11.2 | 1.9 | -0.8 | -1.1 | 1.5 |
| 21 | Miami | 12.0 | 6.5 | 1.9 | -0.3 | 0.4 | 3.5 |
| 22 | Southern California | 11.9 | 1.3 | 3.3 | 3.3 | 0.5 | 3.5 |
| 23 | Washington State | 11.1 | 8.8 | 1.8 | -3.4 | -0.2 | 4.0 |
| 24 | Nebraska | 11.0 | 1.5 | 0.9 | 0.8 | 0.8 | 7.0 |
| 25 | Missouri | 10.8 | 11.4 | 0.1 | -1.3 | 0.6 | 0.0 |
2019 Preseason Ratings Predictive Factors
We’ve done a lot of research over the years to identify and value team-level stats that are highly correlated with success in the upcoming college football season.
Just as importantly, we’ve worked to identify and ignore information that seems like it should help determine how good a team is going to be, but actually doesn’t hold up to rigorous, historical data based testing.
While we encourage you to read our full preseason rankings methodology, here’s a quick explanation of the factors we currently use in our preseason ratings:
LAST YEAR: How good a team was last yearPROGRAM: How consistently good a team has been in recent history (excluding last year)RETURN: A composite measure of returning player performance in several key stat areasLUCK: A measure of how likely a team is to improve in higher-variance metrics like turnoversMARKET: An adjustment made if our initial projection is far off the AP Poll and/or betting market
In a college football or NFL pick’em pool?Get an edge with our Football Pick’em Picks
The Relative Importance Of Rankings Factors
You can see from the relative values in the table above that certain predictive factors are worth more than others. For example, how a team did last season (LAST YEAR) tends to be a very good predictor of how it will do this season.
In comparison, how a team has done over a longer period of recent history (PROGRAM) — more a measure of its success at perennially restocking talent and developing players — also has a predictive impact, but the correlation with upcoming season performance generally isn’t as strong as LAST YEAR.
MARKET, the lone subjective factor of the bunch, can vary widely from team to team. It is an adjustment we make based on team-specific factors that likely represent blind spots in our current preseason ratings algorithm. It deserves an appropriate explanation, which you can also find in our preseason rankings explanation post.
Nebraska: High Hopes vs. Statistical Profile
As one quick example of our market adjustment, though, take No. 24 Nebraska.
With the team entering Year Two under celebrated head coach Scott Frost, AP voters and betting market odds are expecting a big leap in performance from the Cornhuskers, despite a disappointing last season and a general recent downtrend in the quality of the program.
It’s a big vote of confidence from the media and the market that Frost is a leadership talent and will hit his stride this season, because from a historical data perspective alone, such a big jump in performance would seem to be highly unlikely.
In outlier cases like Nebraska’s, we believe the betting market will do at least as good a job of projecting the “Coach Frost Impact” as we could do on our own.
So instead of doing a bunch of custom research and making our best guesses, we simply make a judgment call to adjust Nebraska’s predictive ratings significantly toward the market consensus.
College Football Preseason Rankings Highlights
Similar to last year, our 2019 preseason ratings have a clear top two teams that are well ahead of the field. Last season we had No. 1 Alabama and No. 2 Clemson. This year they’re flipped with Clemson at No. 1, but only by a rating difference of 0.1 points. So it’s a virtual tie.People tend to fixate on rankings, but looking at ratings is more important. Yes, Ohio State ranks No. 5, but the difference between the Buckeyes and the two top contenders is roughly a touchdown on a neutral field. That’s not very close, and it’s about the same difference between Ohio State and No. 13 Penn State.The first real cluster of teams happens at the bottom of the Top 10. No. 7 Oklahoma, No. 8 Florida, and No. 9 Notre Dame are all with two points of No. 6 LSU. In other words, the difference between No. 9 Notre Dame and No. 6 LSU is less than the difference between No. 6 LSU and No. 5 Ohio State.Alabama may be the heavy favorite in the SEC, but the three most likely teams to challenge the Crimson Tide (Georgia, LSU, and Florida) are among the five teams in our Top 25 that benefit most from a returning talent boost. Georgia is the No. 1 ranked team in our RETURN metric this year.We rate Washington, Oregon, and Utah — the three favorites in the Pac-12 — all within 1.6 points of each other on a neutral field.Oklahoma got our biggest luck adjustment upward, meaning that last year’s results could have been a little better even with just average luck in areas such as turnovers. Meanwhile, Utah is in our Top 20 despite the biggest downward adjustment due to luck. The Utes are “saved” by being second-best in terms of returning player continuity in key stat categories.Nebraska, Texas, Oregon and Ohio State got our biggest market adjustments upward. Ohio State has lost a lot of key stat production from departing players, but the Buckeyes also have a track record of reloading. Nebraska and Oregon each enter year two with their current head coaches, so improvements are expected. Texas made a leap forward in Tom Herman’s second season; the Longhorns are dragged down by a low PROGRAM rank because of relatively poor performance from 2015-2017, but the market doesn’t appear to be spooked by that fact.USC, meanwhile, joins Nebraska as one of only two teams that finished last year outside the Top 40 in our predictive rankings, but made the jump into this year’s preseason Top 25. USC’s projected rebound is more traditionally in line with our predictive factors; a recent legacy of performance before last year, an above-average level of returning production, and a hint of likely luck improvement more than make up for USC’s disappointing 2018 rating.
2019 TeamRankings College Football Preseason Rankings (All Teams)
| TR Rank | Team | 2019 Rating | LAST YEAR | PROGRAM | RETURN | LUCK | MARKET |
|---|---|---|---|---|---|---|---|
| 1 | Clemson | 30.9 | 25.1 | 5.2 | 0.7 | -1.5 | 1.5 |
| 2 | Alabama | 30.8 | 23.7 | 6.2 | 0.1 | -1.6 | 2.5 |
| 3 | Georgia | 28.0 | 17.0 | 2.0 | 5.7 | 0.9 | 2.5 |
| 4 | Michigan | 25.3 | 14.7 | 4.3 | 0.7 | 0.1 | 5.5 |
| 5 | Ohio State | 22.9 | 14.2 | 5.3 | -4.1 | 0.5 | 7.0 |
| 6 | Louisiana State | 20.8 | 11.6 | 3.4 | 4.3 | -1.0 | 2.5 |
| 7 | Oklahoma | 20.5 | 15.1 | 4.9 | -1.7 | 1.1 | 1.0 |
| 8 | Florida | 19.3 | 11.7 | 1.9 | 4.0 | -1.3 | 3.0 |
| 9 | Notre Dame | 18.8 | 12.6 | 2.8 | 0.1 | -1.2 | 4.5 |
| 10 | Texas A&M | 16.9 | 12.1 | 2.0 | 0.7 | 0.7 | 1.5 |
| 11 | Auburn | 16.8 | 11.1 | 2.6 | -1.9 | -0.5 | 5.5 |
| 12 | Washington | 16.6 | 9.2 | 4.1 | -2.5 | -0.3 | 6.0 |
| 13 | Penn State | 15.6 | 12.1 | 2.3 | -2.6 | -0.8 | 4.5 |
| 14 | Michigan State | 15.3 | 4.7 | 1.7 | 4.2 | -0.3 | 5.0 |
| 15 | Oregon | 15.1 | 4.5 | 1.1 | 3.1 | -0.6 | 7.0 |
| 16 | Utah | 15.0 | 8.1 | 2.1 | 4.6 | -1.7 | 2.0 |
| 17 | Wisconsin | 14.6 | 6.2 | 3.2 | 3.4 | -0.1 | 2.0 |
| 18 | Texas | 13.3 | 8.6 | 0.8 | -1.9 | -1.2 | 7.0 |
| 19 | Mississippi State | 13.1 | 14.2 | 2.1 | -1.5 | -1.6 | 0.0 |
| 20 | Iowa | 12.7 | 11.2 | 1.9 | -0.8 | -1.1 | 1.5 |
| 21 | Miami | 12.0 | 6.5 | 1.9 | -0.3 | 0.4 | 3.5 |
| 22 | Southern California | 11.9 | 1.3 | 3.3 | 3.3 | 0.5 | 3.5 |
| 23 | Washington State | 11.1 | 8.8 | 1.8 | -3.4 | -0.2 | 4.0 |
| 24 | Nebraska | 11.0 | 1.5 | 0.9 | 0.8 | 0.8 | 7.0 |
| 25 | Missouri | 10.8 | 11.4 | 0.1 | -1.3 | 0.6 | 0.0 |
| TR Rank | Team | 2019 Rating | LAST YEAR | PROGRAM | RETURN | LUCK | MARKET |
| 26 | Central Florida | 10.4 | 10.0 | -2.3 | 1.6 | 0.2 | 1.0 |
| 27 | Stanford | 9.8 | 5.7 | 3.4 | -3.3 | 0.0 | 4.0 |
| 28 | South Carolina | 9.6 | 5.2 | -0.4 | 2.2 | 0.6 | 2.0 |
| 29 | Memphis | 9.4 | 2.0 | 1.8 | 3.8 | -0.1 | 2.0 |
| 30 | Tennessee | 9.3 | -0.5 | 2.4 | 3.6 | 1.9 | 2.0 |
| 31 | Virginia Tech | 9.1 | -0.9 | 2.1 | 4.7 | -0.4 | 3.5 |
| 32 | Minnesota | 8.7 | 3.7 | 0.4 | 5.6 | 1.0 | -2.0 |
| 33 | Boise State | 8.4 | 7.7 | 1.9 | -4.6 | -1.6 | 5.0 |
| 34 | Iowa State | 8.3 | 5.6 | -0.1 | 0.1 | -0.7 | 3.5 |
| 35 | Northwestern | 7.9 | 4.5 | 1.1 | -3.2 | -0.5 | 6.0 |
| 36 | Florida State | 7.4 | -3.5 | 3.1 | 0.6 | 0.2 | 7.0 |
| 37 | Texas Christian | 7.3 | 2.9 | 2.5 | -1.4 | -0.2 | 3.5 |
| 38 | Purdue | 7.1 | 4.8 | -1.9 | -2.7 | -0.2 | 7.0 |
| 39 | Syracuse | 7.0 | 8.9 | -0.8 | 0.3 | -2.4 | 1.0 |
| 40 | Cincinnati | 7.0 | 7.3 | -1.3 | 3.1 | -0.1 | -2.0 |
| 41 | UCLA | 7.0 | -1.7 | 1.3 | 2.8 | 0.6 | 4.0 |
| 42 | Houston | 6.4 | -0.7 | 2.1 | 2.3 | 0.7 | 2.0 |
| 43 | Indiana | 6.4 | 1.0 | 0.1 | 2.4 | 0.4 | 2.5 |
| 44 | Virginia | 6.1 | 5.0 | -0.9 | 1.7 | 0.3 | 0.0 |
| 45 | Kentucky | 5.7 | 9.3 | -0.4 | -0.8 | -0.4 | -2.0 |
| 46 | Oklahoma State | 5.2 | 6.1 | 2.6 | -4.0 | -0.6 | 1.0 |
| 47 | Arizona State | 4.8 | 4.1 | 0.4 | -2.6 | -0.6 | 3.5 |
| 48 | Arizona | 4.6 | -1.8 | -0.5 | 2.6 | -0.2 | 4.5 |
| 49 | Baylor | 4.5 | 0.2 | 2.3 | 2.9 | 3.2 | -4.0 |
| 50 | Pittsburgh | 3.6 | 3.5 | 1.3 | 1.0 | -0.2 | -2.0 |
| TR Rank | Team | 2019 Rating | LAST YEAR | PROGRAM | RETURN | LUCK | MARKET |
| 51 | Appalachian State | 3.5 | 7.9 | 0.8 | 2.8 | -0.9 | -7.0 |
| 52 | Army | 3.5 | 5.6 | -1.8 | 0.8 | -2.2 | 1.0 |
| 53 | NC State | 3.3 | 5.4 | 1.6 | -5.2 | -0.4 | 2.0 |
| 54 | Duke | 2.8 | 3.7 | 0.5 | -3.8 | 0.4 | 2.0 |
| 55 | Boston College | 2.3 | 4.5 | -0.1 | 0.1 | -0.3 | -2.0 |
| 56 | Brigham Young | 1.3 | 2.3 | 1.2 | 1.0 | 0.8 | -4.0 |
| 57 | Texas Tech | 1.0 | 5.8 | 0.8 | -3.7 | 0.2 | -2.0 |
| 58 | North Carolina | 0.6 | -4.5 | 2.3 | -0.3 | 1.1 | 2.0 |
| 59 | California | 0.4 | 0.6 | 1.3 | -3.1 | 0.6 | 1.0 |
| 60 | Vanderbilt | 0.3 | 4.0 | -0.2 | -0.4 | -2.1 | -1.0 |
| 61 | Mississippi | 0.2 | 0.7 | 2.6 | -5.8 | 0.7 | 2.0 |
| 62 | Maryland | -0.2 | 2.9 | -1.0 | 0.1 | -0.7 | -1.5 |
| 63 | Wake Forest | -0.2 | 0.1 | -0.2 | 0.0 | 0.9 | -1.0 |
| 64 | Utah State | -0.3 | 11.0 | -0.8 | -3.2 | -2.8 | -4.5 |
| 65 | Air Force | -0.3 | -1.1 | 0.1 | 0.5 | 0.2 | 0.0 |
| 66 | Fresno State | -0.3 | 10.5 | -3.4 | -6.0 | -1.5 | 0.0 |
| 67 | West Virginia | -0.7 | 11.4 | 2.2 | -7.0 | -1.2 | -6.0 |
| 68 | Colorado | -0.8 | -1.2 | 0.6 | -0.3 | 1.1 | -1.0 |
| 69 | Tulane | -1.1 | -3.5 | -3.1 | 1.7 | -0.2 | 4.0 |
| 70 | South Florida | -1.5 | -8.0 | 1.5 | -0.9 | 0.0 | 6.0 |
| 71 | Arkansas State | -1.6 | -3.0 | -0.5 | -1.9 | -1.1 | 5.0 |
| 72 | Temple | -1.7 | 2.3 | 1.1 | 0.2 | -1.2 | -4.0 |
| 73 | Arkansas | -1.8 | -6.5 | 1.6 | -2.1 | 2.3 | 3.0 |
| 74 | Western Michigan | -1.9 | -6.5 | 1.3 | 2.4 | 0.9 | 0.0 |
| 75 | Kansas State | -2.0 | 0.5 | 1.1 | 0.3 | 0.1 | -4.0 |
| TR Rank | Team | 2019 Rating | LAST YEAR | PROGRAM | RETURN | LUCK | MARKET |
| 76 | Southern Methodist | -2.2 | -5.6 | -2.8 | 1.3 | -0.1 | 5.0 |
| 77 | San Diego State | -2.2 | -4.4 | 1.2 | 3.2 | 0.7 | -3.0 |
| 78 | Marshall | -2.4 | -1.7 | -1.5 | 0.6 | 0.1 | 0.0 |
| 79 | Southern Mississippi | -2.6 | -4.3 | -0.3 | 4.4 | -0.4 | -2.0 |
| 80 | Florida Atlantic | -2.9 | -4.1 | -3.0 | -0.1 | -0.7 | 5.0 |
| 81 | Georgia Tech | -3.0 | 3.6 | 1.3 | -0.5 | -0.3 | -7.0 |
| 82 | Ohio | -3.5 | 4.0 | -1.1 | -0.8 | -1.0 | -4.5 |
| 83 | North Texas | -3.8 | -1.5 | -4.5 | 2.9 | -0.7 | 0.0 |
| 84 | Troy | -4.1 | -0.8 | -0.8 | -3.8 | -0.8 | 2.0 |
| 85 | Illinois | -4.7 | -9.9 | -1.2 | 3.4 | 1.5 | 1.5 |
| 86 | Northern Illinois | -4.8 | -3.2 | -0.7 | 2.5 | 0.1 | -3.5 |
| 87 | Georgia Southern | -5.0 | -0.3 | -0.6 | 2.1 | -5.2 | -1.0 |
| 88 | Florida International | -5.3 | -1.6 | -3.5 | 3.4 | -1.6 | -2.0 |
| 89 | Louisville | -5.4 | -13.9 | 2.6 | 3.2 | -0.3 | 3.0 |
| 90 | Toledo | -6.2 | -0.1 | 1.3 | -0.8 | 0.4 | -7.0 |
| 91 | Louisiana Tech | -6.5 | -6.0 | 0.2 | 0.1 | 0.7 | -1.5 |
| 92 | UL Lafayette | -6.5 | -5.6 | -3.4 | -0.1 | 0.5 | 2.0 |
| 93 | Navy | -6.7 | -6.8 | 1.6 | -1.3 | -0.2 | 0.0 |
| 94 | Tulsa | -6.9 | -8.4 | -0.3 | 1.5 | 0.4 | 0.0 |
| 95 | Hawaii | -7.5 | -8.5 | -4.1 | 1.7 | 1.4 | 2.0 |
| 96 | Nevada | -7.6 | -2.4 | -2.3 | -0.5 | -0.3 | -2.0 |
| 97 | Wyoming | -8.6 | -3.9 | -2.4 | 0.1 | 0.4 | -3.0 |
| 98 | UAB | -8.8 | 1.0 | -2.8 | -5.9 | -0.1 | -1.0 |
| 99 | Oregon State | -8.8 | -11.7 | -1.9 | 4.5 | 2.3 | -2.0 |
| 100 | Miami (Ohio) | -9.1 | -1.8 | -3.4 | -1.3 | -1.2 | -1.5 |
| TR Rank | Team | 2019 Rating | LAST YEAR | PROGRAM | RETURN | LUCK | MARKET |
| 101 | Middle Tennessee | -9.8 | -2.1 | -0.8 | -4.0 | -0.9 | -2.0 |
| 102 | Buffalo | -9.9 | -0.1 | -3.2 | -6.7 | 0.1 | 0.0 |
| 103 | UL Monroe | -10.7 | -9.3 | -4.6 | 1.5 | 1.7 | 0.0 |
| 104 | Rutgers | -10.7 | -10.2 | -2.4 | 1.5 | 0.5 | 0.0 |
| 105 | Eastern Michigan | -10.9 | -2.2 | -3.4 | -0.4 | -1.4 | -3.5 |
| 106 | Western Kentucky | -11.2 | -11.6 | 1.8 | 3.2 | -0.6 | -4.0 |
| 107 | UNLV | -12.1 | -11.2 | -2.6 | 1.9 | 0.7 | -1.0 |
| 108 | Liberty | -12.6 | -10.1 | -1.5 | 4.1 | -0.6 | -4.5 |
| 109 | East Carolina | -12.7 | -13.9 | -1.5 | 1.3 | 3.5 | -2.0 |
| 110 | Georgia State | -13.5 | -14.1 | -2.9 | 3.5 | 1.0 | -1.0 |
| 111 | Texas State | -13.5 | -14.5 | -5.5 | 5.5 | 0.9 | 0.0 |
| 112 | Kansas | -14.0 | -2.6 | -4.4 | -2.9 | -4.0 | 0.0 |
| 113 | Ball State | -14.5 | -10.8 | -3.8 | 2.4 | 2.2 | -4.5 |
| 114 | New Mexico | -14.8 | -10.8 | -1.7 | -2.1 | 1.8 | -2.0 |
| 115 | Colorado State | -14.9 | -12.8 | -0.8 | -3.3 | 0.0 | 2.0 |
| 116 | Charlotte | -16.4 | -8.9 | -5.4 | 2.4 | -0.4 | -4.0 |
| 117 | San Jose State | -17.2 | -12.3 | -2.6 | -0.6 | -0.7 | -1.0 |
| 118 | Coastal Carolina | -17.8 | -10.3 | -3.7 | 1.5 | 1.2 | -6.5 |
| 119 | New Mexico State | -18.2 | -17.8 | -4.4 | 2.2 | 0.3 | 1.5 |
| 120 | South Alabama | -18.9 | -15.2 | -3.5 | -3.5 | 1.3 | 2.0 |
| 121 | Kent State | -19.0 | -13.1 | -3.9 | 3.1 | -0.4 | -4.5 |
| 122 | Old Dominion | -20.2 | -12.3 | -3.3 | -8.3 | 1.8 | 2.0 |
| 123 | Central Michigan | -20.3 | -13.3 | -1.1 | 0.9 | 0.2 | -7.0 |
| 124 | Akron | -20.7 | -9.9 | -2.1 | -2.0 | 0.2 | -7.0 |
| 125 | Texas-San Antonio | -20.8 | -17.2 | -2.9 | 0.5 | 0.9 | -2.0 |
| TR Rank | Team | 2019 Rating | LAST YEAR | PROGRAM | RETURN | LUCK | MARKET |
| 126 | Bowling Green | -20.9 | -15.1 | -0.9 | -4.9 | 2.0 | -2.0 |
| 127 | Connecticut | -21.9 | -22.5 | -2.4 | -1.9 | 1.9 | 3.0 |
| 128 | Rice | -23.0 | -18.2 | -4.4 | -1.9 | 1.5 | 0.0 |
| 129 | Texas El Paso | -24.2 | -19.3 | -5.0 | -2.6 | 2.7 | 0.0 |
| 130 | Massachusetts | -24.6 | -12.1 | -3.3 | -8.1 | 1.0 | -2.0 |
Remember, if you’re in a football pool or planning on betting some games this football season, check out our Football Pick’em Picks , NFL Survivor Picks and College Football Betting Picks.
If you liked this post, please share it. Thank you! Twitter Facebook
NFL Football Pool Picks NFL Survivor Pool Picks NCAA Bracket Picks College Bowl Pool Picks College Football Pool Picks NFL Picks NBA Picks MLB Picks College Football Picks College Basketball Picks NFL Predictions NBA Predictions MLB Predictions College Football Predictions College Basketball Predictions NFL Spread Picks NBA Spread Picks MLB Spread Picks College Football Spread Picks College Basketball Spread Picks NFL Rankings NBA Rankings MLB Rankings College Football Rankings College Basketball Rankings NFL Stats NBA Stats MLB Stats College Football Stats College Basketball Stats NFL Odds NBA Odds MLB Odds College Football Odds College Basketball Odds A product ofTeamRankings BlogAboutTeamJobsContact
© 2005-2024 Team Rankings, LLC. All Rights Reserved. Statistical data provided by Gracenote.
TeamRankings.com is not affiliated with the National Collegiate Athletic Association (NCAA®) or March Madness Athletic Association, neither of which has supplied, reviewed, approved or endorsed the material on this site. TeamRankings.com is solely responsible for this site but makes no guarantee about the accuracy or completeness of the information herein.
Terms of ServicePrivacy Policy

